In today’s fast-paced business environment, maintaining consistent quality is not optional—it’s essential. Companies must deliver products and services that meet or exceed expectations, and one of the most reliable ways to do that is by using quality control tools. These tools are designed to monitor, evaluate, and improve processes to ensure optimal outcomes.
What Are Quality Control Tools?
Quality control tools are standardized methods used to identify, analyze, and correct quality-related issues. They enable businesses to understand where problems occur, why they happen, and how they can be resolved or prevented in the future.
Organizations in both manufacturing and service sectors depend on Quality Control Tools to reduce errors, detect process deviations, and enhance product consistency. These tools turn raw data into actionable insights that support better decision-making.
Why Are Quality Control Tools Crucial?
By integrating Quality Control Tools into daily operations, businesses can improve efficiency, minimize rework, and enhance customer satisfaction. These tools also promote proactive quality management—allowing teams to prevent defects before they occur rather than reacting after the fact.
They are especially useful in ensuring compliance with industry regulations and international standards, helping businesses avoid costly penalties and build stronger brand trust.
The Seven Core Quality Control Tools
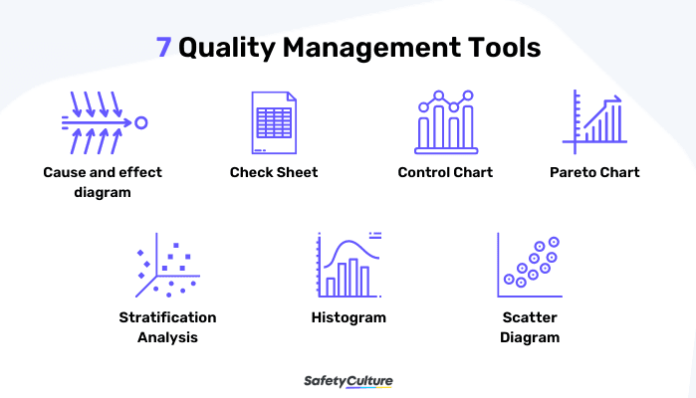
Here are the seven most widely used tools in quality control and process improvement:
- Cause-and-Effect Diagram (Fishbone/Ishikawa)
Breaks down potential causes of a problem into categories for deeper analysis. - Check Sheet
A structured form for collecting real-time data to identify trends or issues. - Control Chart
Monitors process variations over time to ensure consistency and stability. - Histogram
A bar graph that shows the frequency distribution of a dataset, revealing variation. - Pareto Chart
Highlights the most frequent or impactful problems using the 80/20 principle. - Scatter Diagram
Plots the relationship between two variables to explore possible correlations. - Flow Chart
Visually represents a process step-by-step to identify inefficiencies and redundancies.
How to Use These Tools Successfully
- Start with a clearly defined problem
- Select the appropriate tool based on your objective
- Collect and analyze accurate data
- Involve your team to interpret results collaboratively
- Implement changes and monitor outcomes
Conclusion
Quality control tools are essential for businesses committed to high performance and continuous improvement. They provide structure, reduce guesswork, and help deliver consistent, high-quality results. When used effectively, these tools become powerful assets in building a reputation for reliability, efficiency, and excellence.


